The Bottleneck No One Could Measure
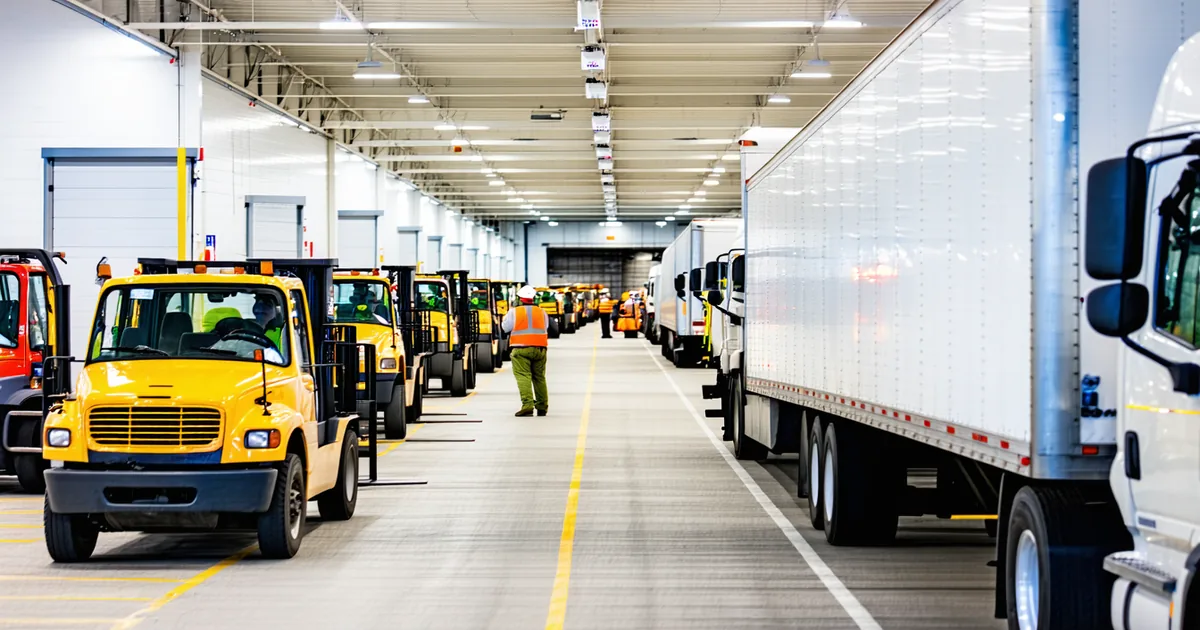
Consider a regional distribution hub operating out of Memphis, Tennessee — a facility processing roughly 1,800 inbound and outbound pallet movements per day across eight loading dock doors. The facility's operations director had a persistent gut sense that their afternoon shift was consistently underperforming relative to morning, but three months of manually compiled shift logs and supervisor observations had not produced an explanation that held up to scrutiny.
The working theories cycled through familiar candidates: afternoon staffing quality, equipment availability, driver arrival clustering. None of the available data was granular enough to confirm or eliminate any of them. What the facility had was a fleet of 22 IP cameras covering every dock door, staging lane, and main corridor — generating continuous footage that no one was analyzing beyond security incident review.
This is the situation that zone density monitoring is designed to address. The infrastructure to measure what is happening in each zone already exists. The gap is the layer that converts video data into operational numbers.
What Zone Density Monitoring Measures at a Dock
Zone density monitoring tracks worker and equipment presence within operator-defined areas continuously. At a loading dock, the relevant zones are typically: the dock apron immediately behind each door, the primary staging lane where pallets queue before loading, the secondary staging area where inbound freight is separated by route, and the main corridor connecting dock operations to receiving.
For each zone, the system generates several types of continuous data: occupancy rate (percentage of time at least one worker or forklift is present), peak density events (periods when occupancy exceeds the operational threshold for the zone), dwell time distributions (how long workers and equipment spend in each zone per interaction), and queue depth proxies (how frequently pallets accumulate to a density level that constrains movement).
None of these measurements require sensor retrofitting on forklifts or pallets. They are inferred from camera observations of the physical state of each zone at each moment during the shift. The operational picture that emerges from aggregating those observations across a full shift is substantially more detailed than anything a manual observation protocol could produce.
What the Data Showed
In the Memphis facility scenario, deploying zone monitoring across the eight dock doors and their associated staging lanes produced a pattern within the first week of operation that the supervisor observation logs had not surfaced.
The primary staging lane for doors 5 through 8 — the four doors assigned to the largest outbound carrier accounts — was experiencing a density event that peaked consistently between 2:15 PM and 3:45 PM. During that 90-minute window, the staging lane was operating at 140% of its effective capacity: pallets were queuing deep enough that forklift operators completing pick-and-load cycles had to wait for the staging lane to clear before they could position for their next load. The wait time averaged between four and seven minutes per cycle.
Across eight active forklift operators during the afternoon peak, a four-to-seven-minute delay per cycle compounded into approximately 45 to 60 minutes of aggregate forklift idle time per day concentrated in that 90-minute window. That idle time was not visible in any existing operational metric. It appeared in the supervisor's shift log as "normal afternoon flow" because the forklifts were technically present and nominally active — they were waiting, not absent.
The root cause, once the density data surfaced the pattern, was straightforward: afternoon inbound receiving from three LTL carriers was creating a surge in the secondary staging area that overflow-spilled into the primary staging lane, physically blocking outbound staging operations. The two flows — inbound LTL freight and outbound carrier staging — were sharing physical space during a 90-minute overlap that didn't exist during morning shift because morning inbound volume was lower.
The Fix and the Measurable Outcome
The operational adjustment was not complicated: resequence the afternoon LTL receiving windows so that the three carriers whose freight was creating the staging conflict arrived in two earlier windows (before 1:30 PM) and one later window (after 4:00 PM), separating the inbound and outbound staging peaks. The change required renegotiating appointment windows with two carriers and adjusting the receiving crew schedule by 45 minutes.
After the schedule adjustment, zone density monitoring confirmed that the primary staging lane for doors 5 through 8 returned to below-threshold density during the 2:15 PM to 3:45 PM window. The aggregate forklift idle time in that period dropped from 45-60 minutes per day to under 8 minutes per day. Afternoon shift throughput improved by 11% measured in pallet moves per shift-hour for that dock group, and the shift performance gap between morning and afternoon narrowed to within 4% — from a gap that had been running at 14-18% for the preceding quarter.
We are not saying that zone density monitoring revealed something that an experienced operations director should not have been able to figure out through observation. Experienced operations people do figure out patterns like this — eventually. The value of the monitoring layer is that it compresses the timeline from "persistent unexplained underperformance" to "quantified root cause with a verifiable fix" from months to days, and it makes the verification of the fix automatic rather than dependent on another round of manual observation.
What This Pattern Looks Like in Other Facility Types
The loading dock bottleneck is one of the most common patterns that zone density monitoring surfaces in distribution environments, but the structural mechanism — two flow types sharing constrained physical space with a timing overlap that creates an invisible collision — appears in other facility contexts as well.
In a manufacturing context, the equivalent is an assembly line buffer zone that serves both completed-subassembly accumulation and incoming-component staging. When the two accumulation patterns coincide during a production peak, the buffer zone goes over capacity, the upstream assembly station slows to avoid overflow, and throughput falls without any individual piece of equipment showing a fault state. The zone density data shows the overlap; the machine data shows a slowdown; only the combination reveals the cause.
In food processing environments, similar patterns emerge at transition zones between production and packing: when packing line changeovers coincide with high-output production periods, product accumulates in the transition zone faster than the packing crew can clear it, creating a density buildup that forces production to slow. Without zone density measurement, the throughput impact shows up as a packing line efficiency variance — the wrong place to look for the fix.
The Monitoring Stack That Makes This Possible
The analysis described above does not require any changes to the warehouse management system, any new IoT sensors on forklifts, or any manual data collection. It requires only that the existing IP camera coverage of the dock and staging areas feeds a vision system configured with zone definitions that match the operational structure of the facility.
The zone definitions take approximately half a day to configure during initial deployment. The facility's floor plan is loaded into the zone editor; the operator draws boundaries around each dock door apron, each staging lane, and the main corridor; and the system begins generating density data from those zones immediately. The first week of data establishes the baseline; deviations from the baseline are visible in the shift-end operational summary report that the system generates automatically.
For operations directors who have been explaining throughput gaps with theory rather than data, that shift — from inference to measurement — is the practical value of deploying a camera-based observability layer on infrastructure the facility already owns.